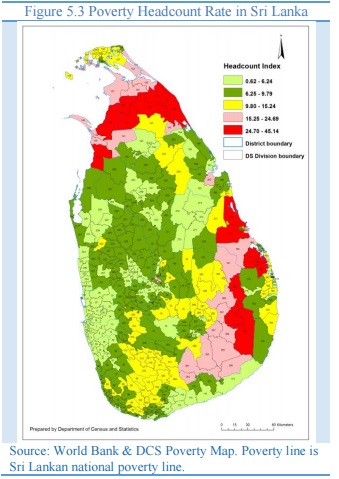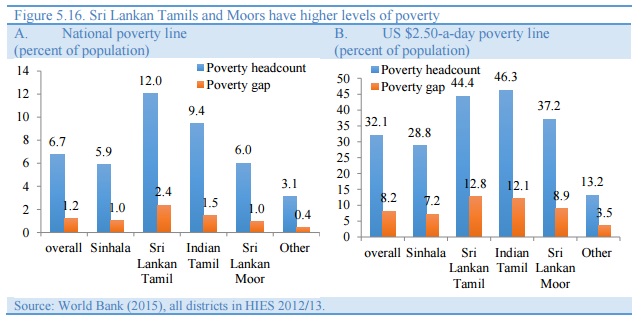
Regions with the highest rate of poverty in Sri Lanka are areas inhabited by Tamils, according to Sri Lanka a study of the World Bank 2015.
The regions come under the districts of Mannar, Mullaitivu and Kilinochchi in the Northern Province; Batticaloa in the East and plantations in Badulla district (Uva Province) and Nuwara Eliya (Central Province). One Sinhala-dominated region the study has identified as having a high rate of poverty is the Monaragala district.
Mullaitivu, the poorest
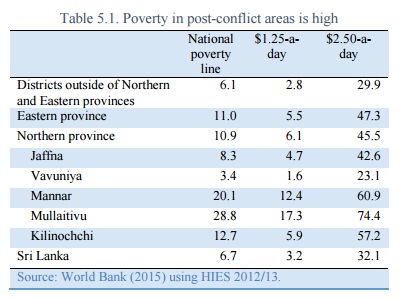
Going by Sri Lanka’s national poverty line of about $1.50 per day (Purchasing Power Parity in 2005), the poverty headcount rates of Mullaitivu, Mannar and Kilinochchi are 28.8 per cent, 20.1 per cent and 12.7 per cent respectively.
If one were to apply the international poverty line of $2.5 per day, the figures in these three districts are 74.4 per cent, 60.9 per cent and 57.2 per cent respectively.
With respect to the estates, the poverty headcount rate is 10.9 per cent, as per the Sri Lanka’s national poverty line and this goes up to 50.6 per cent under the international poverty line.
Though the World Bank has not specifically given the figure of Batticaloa, a 2014 publication of the Department of Census and Statistics of the Sri Lankan government mentioned that the figure (as in 2012-2013) was 19.4 per cent.

As for the age profile of the poor in the North and East, the study points out that about 47 per cent of people living in poverty come under the group of below 25 years, compared to 40 per cent in other Provinces.
Lack of access to the labour market and high unemployment rates, particularly among the youth and among educated women, are the factors that have contributed to the prevalence of such high rates of poverty.
On the people in the estate sector, the World Bank’s report has said a large share of the population is “vulnerable to adverse shocks”.

Describing as worrisome the non-monetary indicators of health and nutrition in the estates, the document has pointed out that the estates have the highest maternal mortality rates in the country. “About 30 percent of children below 5 are underweight, nearly one in three babies born have low birth weight, and one-third of women of reproductive age are malnourished.”
 The World Bank has called for the implementation of programmes aimed at improving market accessibility, incentives to promote entrepreneurship among educated youth and schemes to help ex-combatants and women-headed households. As for the estates, multi-sector interventions should be undertaken to improve nutrition outcomes, enhance job opportunities for the youth and prepare for a growing number of aging estate workers, the report has added.

***
| Millennium Development Goals: A comparative analysis | |||||||
|---|---|---|---|---|---|---|---|
| Sri Lanka | South Asia Region | ||||||
| Then | Now | ||||||
| Goal | Indicator | Year | Value | Year | Value | Year | Value |
| Extreme poverty People living | Reduction by half below $ 1.25 per day (%) | 1991 | 15 | 2010 | 4.1 | 2010 | 29.7 |
| Universal primary education | Enrollees per 100 children | 2001 | 99.8 | 2012 | 93.9 | 2012 | 94.4 |
| Gender Equality | Women’s share in wage employment in non-farm sector (%) | 1997 | 30.2 | 2012 | 30.4 | 2012 | 19.8 |
| Women’s representation in national legislature (%) | 1990 | 4.9 | 2014 | 5.8 | 2014 | 16 | |
| Child mortality rate reduction by two-thirds | Deaths of under-five children per 1,000 births | 1990 | 21.3 | 2013 | 9.6 | 2013 | 55 |
| Maternal mortality rate reduction three quarters | Maternal deaths per 1,00,000 live births |
1990 | 49 | 2013 | 29 | 2013 | 190 |
| Halt and reverse HIV/AIDS spread | HIV incidence rate | 2001 | 0.01 | 2012 | 0.01 | 2012 | 0.02 |
| Reverse forest loss | Green cover (%) | 1990 | 36.4 | 2010 | 28.8 | 2010 | 14.5 |
| Internet penetration | Internet users per 100 inhabitants | 1990 | Nil | 2013 | 21.9 | 2012 | 12.3 |
| Source: “Sri Lanka – Ending Poverty and Promoting Shared Prosperity”, World Bank, 2015 | |||||||
Sri Lanka – Ending poverty and promoting shared prosperity : a systematic country diagnostic (English)
ABSTRACT
Between 2002 and 2012-13, most of the reduction in poverty was due to increased earnings, as opposed to higher employment or higher transfers. Although it is hard to be certain, increases in earnings are associated with: (i) a slow structural transformation away from agriculture and into industry and services that led to productivity increases; (ii) agglomeration around key urban areas that supported this structural transformation; (iii) domestic-driven growth, including public-sector investment that led to increases in labor demand, particularly in industry and services; and (iv) a commodity boom that led to higher labor earnings for agricultural workers in the context of lower agricultural employment. Sri Lanka’s has had impressive development gains but there are strong indications that drivers of past progress are not sustainable. Solid economic growth, strong poverty reduction, overcoming internal conflict, effecting a remarkable democratic transition in recent months, and overall strong human development outcomes are a track record that would make any country proud. However, the country’s inward looking growth model based on non-tradable sectors and domestic demand amplified by public investment cannot be expected to lead to sustained inclusive growth going forward. A systematic diagnostic points to fiscal, competitiveness, and inclusion challenges as well as cross-cutting governance and sustainability challenges as priority areas of focus for sustaining progress in ending poverty and promoting shared prosperity.
DETAILS
- 2015/10/01 22:58:04
- Systematic Country Diagnostic
- 100226
- 1
- 1
- Sri Lanka;
- South Asia;
- 2015/10/12 23:57:50
- Sri Lanka – Ending poverty and promoting shared prosperity : a systematic country diagnostic